The Human Genome is a complex and intricate environment that, through mutations, inheritance, and relative strengths of genes, can change and develop over time. Sometimes, these changes prove valuable, an example being the loss of hair in humans leading to better performance in long distance running, but this change can also prove problematic. These problems caused by genetics are known as Genetic Diseases or Disorders. They can be caused by mutations in a person’s genetic code but they are usually inherited from an individual’s parents. Each parent will supply half of the child’s genetic code, though the exact combination supplied is never repeatable. This variation leads to great diversity in offspring and variation in inherited traits.
Genetic Diseases can occur from either dominant or recessive genes, though each of these is seen in different ways. When there are multiple forms of a gene, each type is called an allele. Because there are two chromosomes, each with one allele, that share responsibilities, we study allele pairing as a way to study a person’s genotype, allele combination. Different alleles often have different strengths in how they appear in an organism’s phenotype, or displayed traits. To study a child’s potential genotype, we first try to determine the parent’s genotype. To find an organism’s genotype, we often look at the phenotype and compare that to statistical probabilities. This system does have some errors as if one allele is dominant, then regardless of the other allele, the trait will appear in the phenotype. Allele pairing has specific vocabulary that represents different possible combinations. If the alleles are both the same, dominant or recessive, than it is a homozygous pair, dominant or recessive. If the alleles are different, then the combination is called a heterozygous pair. When trying to determine the genotype of an organism, we have to use phenotypic data of the family, and a system known as punnett squares to help determine the potential genotype of an individual.
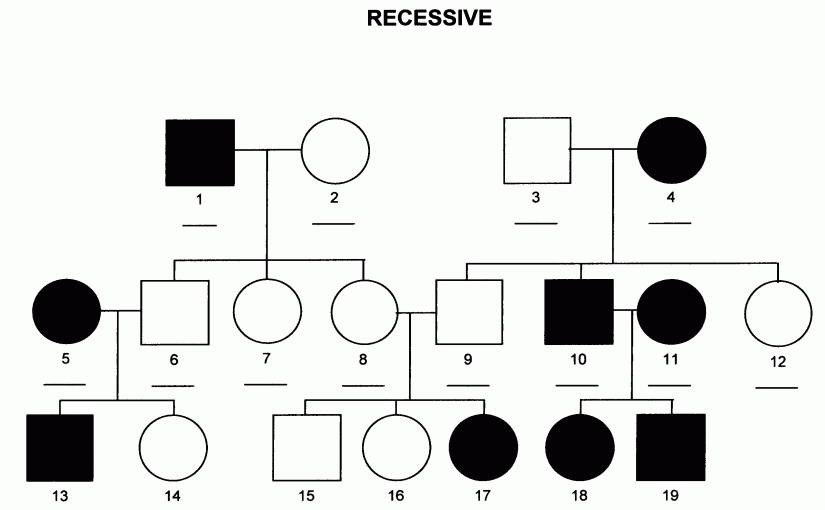
In the following diagram, squares represent males and circles represent females, black represents affected and white represents unaffected. We know the trait is recessive and this allows us to determine the genotype of many individuals.
We start with the affected individuals. We know that the trait is recessive so person 1, 4, 5, 10, 11, 13, 17, 18, and 19 are all homozygous recessive; they all have two recessive alleles.
Now we work backwards. We know 3, 6, 7, 8, 9, 12, and 14 are all heterozygous, also known as carriers. We know 3, 6, 8, and 9 are carriers because while they do not show the trait, they have children who do, meaning they must carry the trait. We also know 6, 7, 9, 12, and 14 are carriers because they have a parent who shows the trait. If the parent has the trait, they can only pass the recessive allele to their children, meaning that every child is at least a carrier.
Data like this chart can enlighten researchers as to the genotype of an individual but for some people, we can only guess at best. For person 15 and 16, we know both parents are carriers because they have a child who has the trait, but we don’t know if 15 and 16 are carriers because they can be Heterozygous or Homozygous Dominant and will appear the same. To evaluate the statistical chance towards a genotype, scientists can use a Punnett Square, a table that allows comparison of potential genotype. We first have to know the genotype of each parent. We know that both parents are Heterozygous as seen above allowing us to make our chart.
Â
| T | t | |
| T | TT | Tt |
| t | Tt | tt |
Â
In the chart, the top row represents one parent and the left column represents the other. We are using capital T’s to indicate the dominant trait and normal t’s to represent the recessive trait. The inner spots represent the potential genotype of the child depending on the allele given by each parent. As we can see, three out of four potential genotypes will result in the dominant phenotype, while only one of four will result in the recessive phenotype. One in two children will likely be carriers. It is important to know that this data is statistical and the genotype of one child has no impact on the genotype of another. This explains why we can’t determine the genotype of person 2. Person 2 has no children with the trait but is breeding with person 1, who does. Person 2 could be a carrier who has not passed on the recessive trait, or she could be Homozygous Dominant, not giving her an opportunity to pass on the gene.
There are many things that can cause genetic variation but when studying genetic diseases and disorders, most diseases can be traced backwards through the family line. We must study the family history of an individual to understand conditions and traits.