Background
In this lab we worked in pairs to throw in order to dive deeper into the ideas of crossing over. To do this we tossed Popsicle stick toward a vertical line on a piece of paper. The vertical line was marked A, B, C, D, E, and F and each were at their own respective points on the line (1cm, 3cm, 6cm, 10cm, and 15cm). If the Popsicle stick landed off the line the throw did not count, but if it landed on the line what ever part was separated from the line is what we tallied. We were suppose to do this until crossing over occurred 100 times. My group made some errors while doing this lab, but it did not exactly hinder our results. Instead of tossing the Popsicle stick 100 times, we did the lab until there was around 100 genes separated. B was separated 4 times, C 6 times, D 19 times, E 35 times, and F 37 times. This makes sense because it is easier to separate D,E, and F than it is B, and C. This is because the throw is more likely to land past B, and C. The frequency of crossing over correlated to the amount of times the gene was separated, for example B was separated 4 times so it had a frequency of 4.
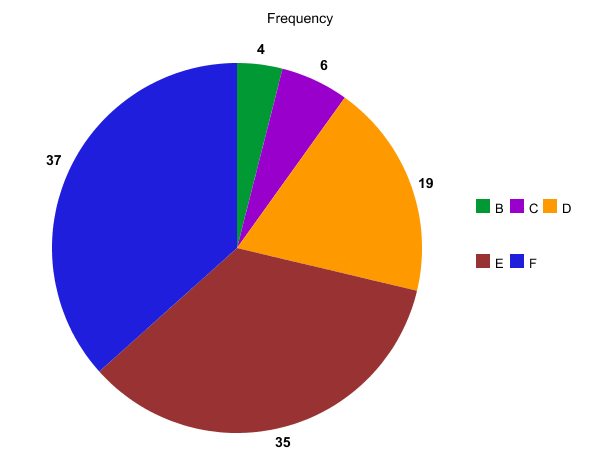
I made this pie graph to represent which gene crossed over the most. This visual shows what the table already expressed.Which is that F and E are the majority, D is in the middle, and B and C were less common.
Great visual using the pie chart – nice job 🙂