 
Have you ever wondered why a child may differ so much in physical appearance from it’s parents? The fact that no one person shares the same characteristics with you is really quite fascinating. During the process in which gametes are created, diploid cells are separated into haploid cells. This process is called myosis and is responsible for recombining gene sequence to create genetic diversity.  During myosis, sister chromosomes meet in pairs near the middle of the cell before division. During this time, chromosomes are nestled closely together and swap sections of their genetic code in a process called crossing over. Crossing over and the swapping of genes is responsible for genetic recombination and the difference in two individuals’ appearances.
To simulate the process of crossing over and to calculate the frequency of separation,  a diagram representing a chromosome was drawn. Different genes were placed unevenly across the length of the chromosome to represent the genetic sequence on the chromosome. To simulate the point at which separation occurred a popsicle stick, which represented the sister chromosome, was thrown in the air and landed randomly on the diagram. The popsicle stick was thrown about 50 times (more because it didn’t always land on the chromosome…) to get an accurate picture of the relationship between the distance of the genes and  frequency in which genes were separated. Once 50 successful throws were completed, the frequency of separation was multiplied by two for easier calculations
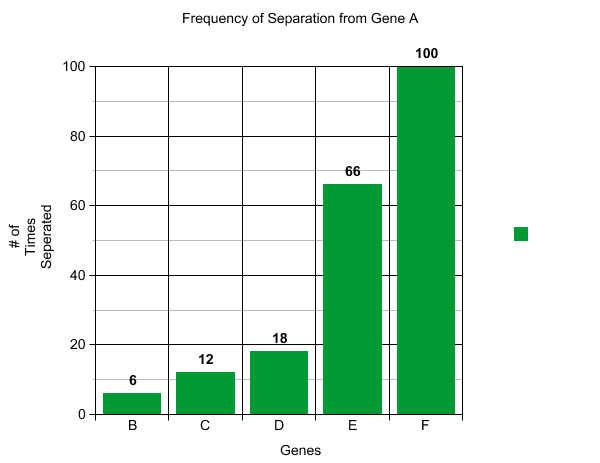
Through tossing the popsicle stick, I noticed that some genes had a much higher frequency of separation than other genes. This higher frequency was due to the fact that the distance between these genes was larger. This meant that the popsicle stick had a higher probability of landing in between genes with a larger distance separating them opposed to a shorter distance.  In the diagrams below, the frequency of separation for each gene is indicated. 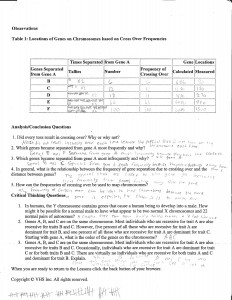
 While conducting this simulation, there were a few inconstancies and areas of improvement. In order to gather more accurate data, the chromosome diagram should be taped down to prevent it from moving and causing a variance in distance. Also, the chair should be secured as well. If the throwing distance is changed each time it causes less-accurate results to be recorded.
Through this simulation, I was able to understand the concept of crossing over and separation better. It is truly amazing how when two or more genes undergo recombination, a person’s characteristics can be molded to distinguish itself from others.